Job Growth & Unemployment
Posted on 05/21/2019 by Beverly Kerr
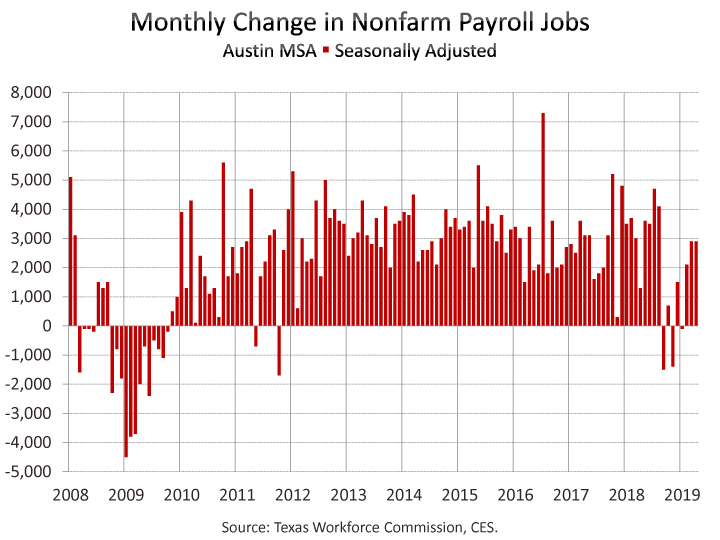
- Austin added 26,100 net new jobs, growth of 2.5%, in the 12 months ending in April, making Austin the 12th fastest growing major metro.
- Wholesale trade grew by 7.7%, making it Austin’s fastest growing industry, while professional and business services added the most jobs (8,200) over the last 12 months.
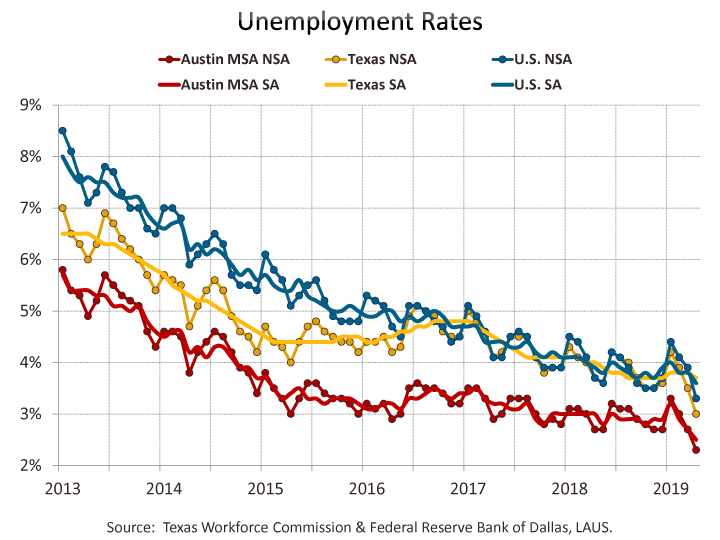
- Austin's seasonally adjusted unemployment rate is 2.5%, down from 2.7% in March.
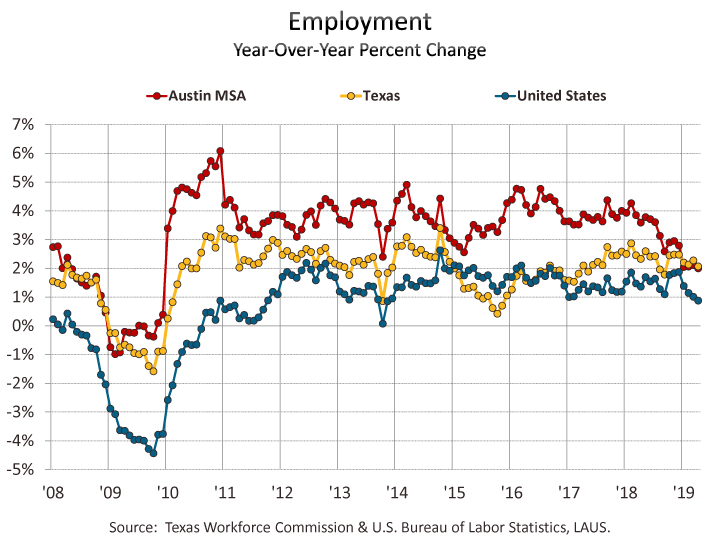
The Austin metropolitan area added 26,100 net new jobs, or 2.5%, in the 12 months ending in April, according to Friday's releases of preliminary Current Employment Statistics (CES) payroll jobs numbers by the Texas Workforce Commission (TWC) and the U.S. Bureau of Labor Statistics (BLS).
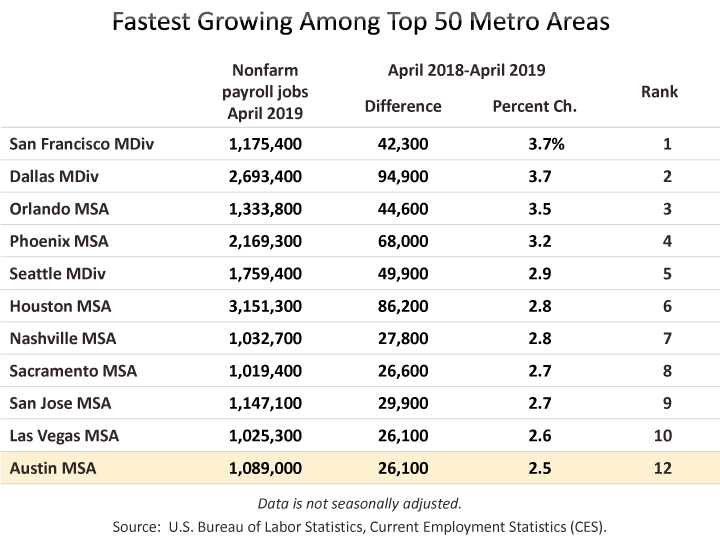
Austin’s 2.5% growth makes it the 12th best performing among the 50 largest metro areas. Dallas and Houston, gaining 3.7% and 2.8% respectively, made the top ten. San Antonio and Fort Worth, both gaining 2.0%, ranked 18th and 19th.
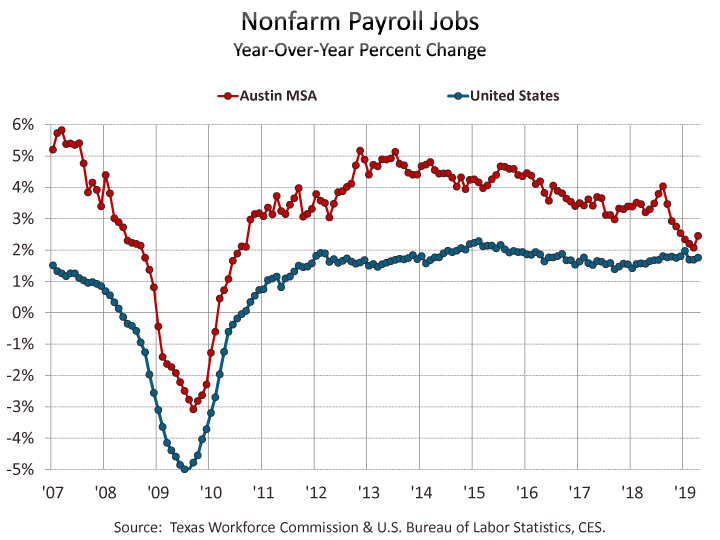
The TWC also released data last week from an alternative jobs series called the Quarterly Census of Employment and Wages (QCEW). QCEW estimates are based on administrative records (from the unemployment insurance program) and publication lags the sample-survey-based CES estimates by several months. Because CES estimates for Austin began showing a precipitous slowdown in Austin’s job growth beginning late last year (see year-over-year change and percent change line graphs below), we’ve been looking forward to a new quarter of QCEW to see whether or not it reflects a similar slowing. As it turns out, while CES estimates show Austin’s job growth being 2.5% for the year ending December 2018, the new data through the end of the year from QCEW shows job growth of 3.7%. CES estimates include classes of workers not covered by QCEW and growth rates between the two series may not necessarily align, however, QCEW is the primary input to the annual benchmark revisions to preliminary CES estimates.[1] The Federal Reserve Bank of Dallas produces their own version of the CES series that is benchmarked to QCEW quarterly for a more timely view of economic growth around the state. A new article about their jobs series is available here, however Dallas Fed jobs estimates through April will not incorporate the latest QCEW data until later this month. See footnote [2] below for illustration of the current differences between the CES and QCEW series and see the footnote from last month’s article for an alternative comparison of preliminary and revised CES data.
So, while we have an interesting signal from QCEW that job growth was likely more robust through 2018 than CES indicates for Austin, preliminary CES estimates through April are what we have to rely on for the time being and we return to these below.
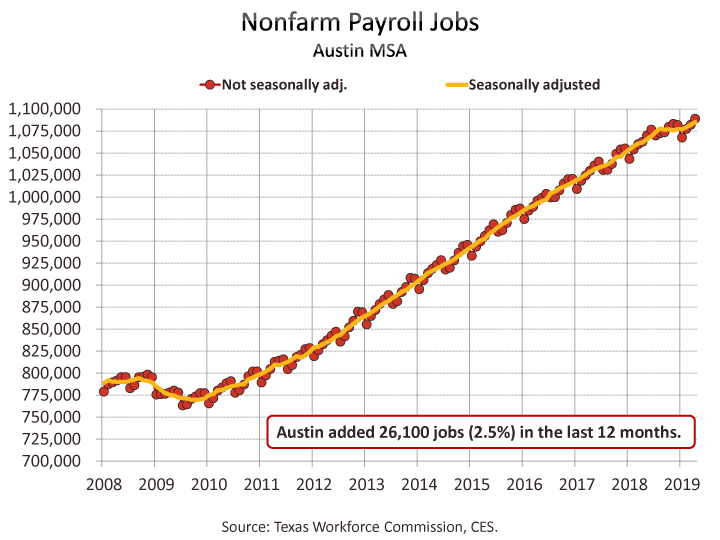
For the year ending in April, private sector growth in the Austin MSA is 2.9%, or 25,300 jobs, with all private industry divisions but retail trade adding jobs. Austin's sizable government sector (17% of jobs) grew by only 800 jobs or 0.4%, thus bringing the overall growth rate to 2.5%.
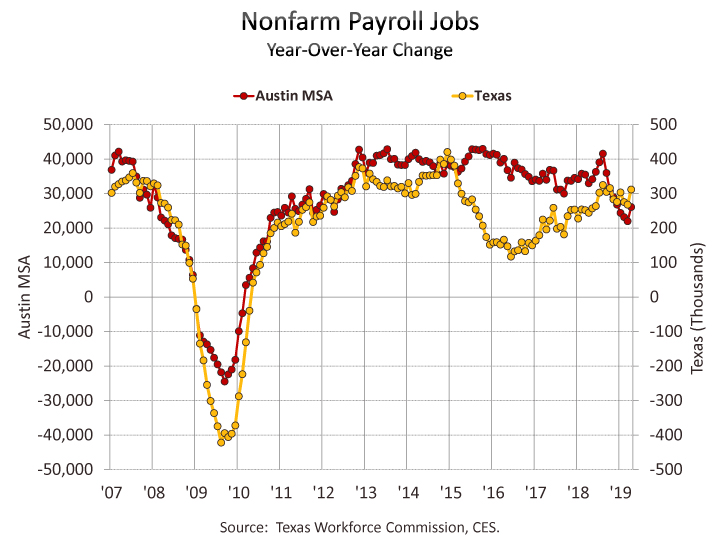
Texas also saw net private sector job growth of 2.9% with all private industries but information adding jobs over the last 12 months. Total job growth was 2.5% as the government sector, which accounts for nearly 16% of total state employment, saw slight growth (0.6%). For the nation, private sector growth is 2.0% for the 12 months ending in April with all private industries, but two, adding jobs. Overall job growth is a more modest 1.8% because of minor (0.6%) government sector growth.
Jobs in April are up from the preceding month by 6,800 jobs or 0.6% in the not-seasonally-adjusted series for Austin. In the seasonally adjusted series, growth is also positive, up by 2,900 jobs or 0.3%. Seasonally adjusted jobs are up by 0.2% in Houston and Dallas, 0.1% in San Antonio, and essentially unchanged in Fort Worth. Statewide, seasonally adjusted jobs are up 28,900 or 0.2%. Nationally, seasonally adjusted jobs are also up 0.2% from March.
In Austin, professional and business services added the most jobs, 8,200 (4.5%), over the last 12 months. The fastest growing industry was wholesale trade which grew by 7.7% or 3,800 jobs. Also growing at faster-than-average rates are financial activities (4.5% or 2,800), information (4.3% or 1,400), and manufacturing (4.0% or 2,400). Retail trade is down by 400 jobs or 0.4%.

Statewide, construction and natural resources grew fastest (by 5.1%) and added the most jobs (49,300 jobs) over the last 12 months. The other relatively fast growing industries were manufacturing (3.8%), other services (3.7%), wholesale trade (3.6%), and leisure and hospitality (3.4%). Information jobs fell by 1.3%.
Nationally, construction and natural resources grew fastest, adding 3.6% over the 12 months ending in April. Leisure and hospitality (2.8%); transportation, warehousing, and utilities (2.7%); professional and business services (2.6%); and education and health services (2.5%) were also relatively fast growing. Information and retail trade lost jobs (0.6% and 0.4% respectively).

The net gain for private service-providing industries in Austin is 21,100 jobs, or 2.8%, over the last 12 months. Employment in goods producing industries is up by 4,200 jobs or 3.4%. Statewide, private service-providing industries are up 218,100, or 2.5%, and goods producing industries are up 82,100 jobs, or 4.5%.
We also now have April labor force, employment, and unemployment numbers for Texas and local areas in Texas. The same data for all U.S. metros will not be released until May 29. In March, Austin had the fourth lowest rate of unemployment among the 50 largest metros.
Unemployment numbers for April show Austin’s performance relative to the state and other major Texas metros being sustained. In April, Austin is at 2.3%, while the other major metros range from 2.6% in San Antonio to 3.2% in Houston. Dallas and Fort Worth are at 2.8%. Austin’s rate one year ago was 2.7%. The rates in the other major Texas metros are also improved from a year ago. The statewide not-seasonally-adjusted rate is now 3.0%, down from 3.7% in April of last year. The national unemployment rate is 3.3%, improved from 3.7% a year ago.

Within the Austin MSA, Travis County has the lowest unemployment rate in April, at 2.2%, while Caldwell County has the highest at 2.8%. The rate is 2.3% in Hays County, 2.4% in Williamson County, and 2.5% in Bastrop County.
On a seasonally adjusted basis, Austin’s April unemployment rate is 2.5%, down from 2.7% in March. The statewide seasonally adjusted rate is 3.7% in April, down from 3.8% in March. The national rate is 3.6% in April and improved from 3.8% March.
Among Texas’ major metros, San Antonio has the next lowest seasonally adjusted rate at 2.9%, Dallas and Fort Worth are at 3.0% and Houston is at 3.5%. Each metro’s rate is improved from March. Seasonally adjusted unemployment rates for Texas metros are produced by the Federal Reserve Bank of Dallas. (The TWC also produces seasonally adjusted rates for Texas metros, but publication lags the Dallas Fed’s data.)

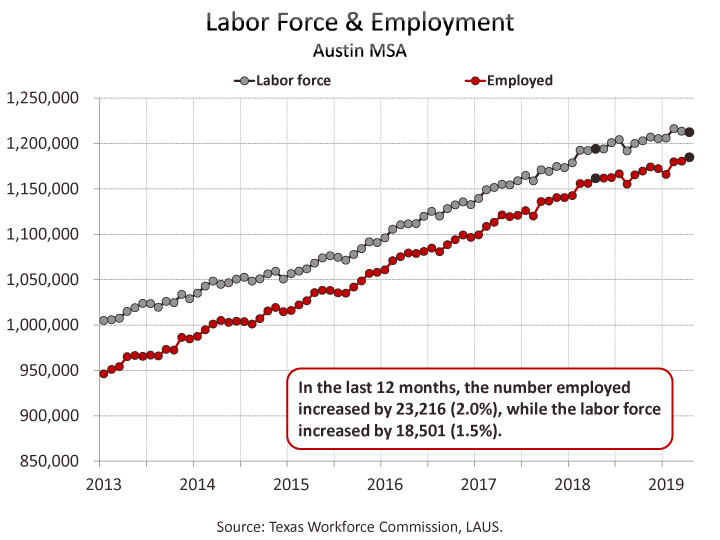
With Austin’s unemployment rate down from one year ago, the number unemployed has also fallen. In April 2018, Austin’s number of unemployed was 32,360. Over the last 12 months, the unemployed declined by 4,715 or 14.6%, to 27,645.[3] This is due to a larger increase in the number employed, compared to labor force. The Austin metro’s civilian labor force (employed plus unemployed) increased by 18,501 persons or 1.5% from one year ago, while persons employed increased by 23,216 or 2.0%.
Texas’ employment growth (275,289 or 2.1%) also exceeds labor force growth (183,696 or 1.3%). Thus, the number of unemployed decreased by 91,593 or 18.1%. Nationally, April civilian labor force is up by 0.8 million or 0.5%, while employed is above the level of a year ago by 1.4 million or 0.9%, and 0.5 million fewer people (9.2%) are unemployed.
The TWC and the BLS will release May estimates on June 21.
The Chamber’s Economic Indicators page provides up-to-date historical spreadsheet versions of Austin, Texas and U.S. data for both the Current Employment Statistics (CES) and Local Area Unemployment Statistics (LAUS) data addressed above.
[1] Several years of CES estimates are revised in March of each year, using QCEW data through the preceding September.
[2] Comparison of CES and QCEW estimates of nonfarm payroll jobs for the Austin MSA:
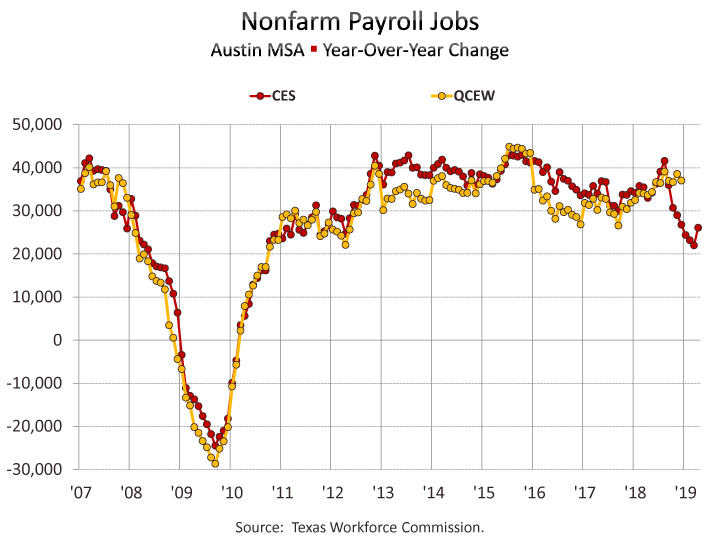

Note that the Excel file of nonfarm payroll jobs time series data on the Chamber’s Economic Indicators page includes not only the CES data (total, private, and major industry sectors), but also the QCEW series (total and private industry), and the seasonally adjusted and early-benchmarked Dallas Fed series (total). Due to issues of timeliness and for comparison to other geographic areas, this article, like most reporting elsewhere, will be focused on the BLS/TWC CES data, but it can be helpful to be aware of the limitations of the sample survey and the potential for actual growth to be higher or lower than preliminary estimates indicate. Also see last month’s jobs article for a comparison of preliminary and revised CES estimates. As a relatively fast growing metro, it may be that the sample survey of employers in our area is insufficiently representative. With unemployment as low as it has been in Austin over the last couple of years, it is reasonable to expect job growth to slowing, but with the divergence between CES and QCEW data we see in 2018 Q4, there is some room to question if growth is currently quite as low as 2.5%.
The Texas Comptroller’s office receives a briefing and economic forecast from IHS Markit twice a year. The briefing includes a ranking of the 55 largest U.S. metros for average annual job growth over the coming five years. The ranking delivered at the May briefing showed Austin as the fastest growing job market nationally, but they estimate Austin’s average annual growth rate for the period will be 1.9%.
[3] The last time Austin saw fewer than 30,000 unemployed was during a few months in 2007. Today’s labor force is about 44% larger than it was in 2007.