Entrepreneurship
Posted on 09/14/2016 by Beverly Kerr
- Startups account for a larger share of businesses in Austin than in nearly all major U.S. metros.
- Women-owned firms represent over 20% of Austin businesses with paid employees.
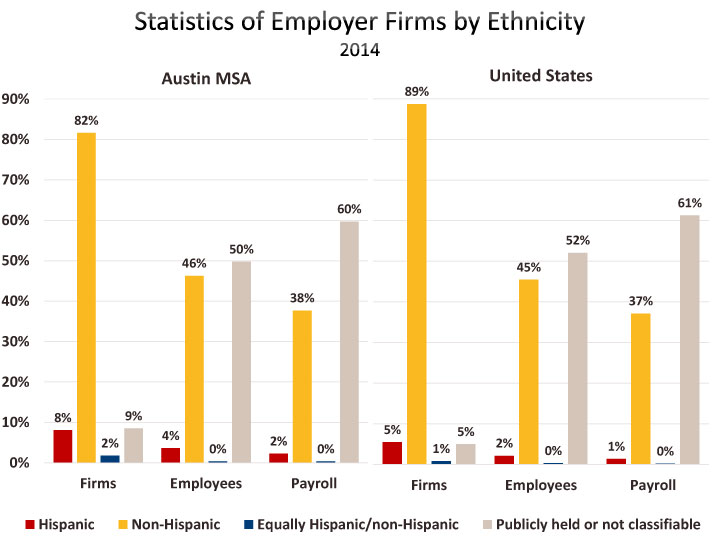
- Minority entrepreneurs make up 17% of area business owners. Hispanics and Asians are the two largest minority groups among business owners in Austin, representing 8% and 7% of employer firms respectively.
- Veteran business owners account for 9% of Austin employer firms.
- Half of Austin's private sector workforce is employed by firms that are publicly held or otherwise not classifiable by owner characteristics such as gender, race and ethnicity.
Young firms account for a larger share of businesses in Austin than in nearly all other major U.S. metros. Of the 34,771 firms in Austin in 2014 with paid employees, 11.7% (4,072) have been in business less than two years, 27.0% (9,391) have been in business less than four years, and 38.9% (13,513) have been in business less than six years. As the table below shows, Austin ranks 2nd for the share of firms in business less than two years and less than six years, and 3rd for the share of firms less than four years old. Las Vegas ranks first across all three young firm age ranges.
Nationally, 8.9% of firms with paid employees have been in business less than two years, 22.0% have been in business less than four years, and 31.7% have been in business less than six years.
This data comes from this month’s inaugural release of a new annual survey from the U.S. Census Bureau called the Annual Survey of Entrepreneurs that will supplement the Survey of Business Owners, which is conducted every five years. This new survey provides a timely and more frequent socioeconomic portrait of employer businesses by gender, race, ethnicity, and veteran status. This annual survey includes a new dimension, years a firm has been in business, which is not found in the Survey of Business Owners. New annual data on job-creating startups and other employer firms will be a boon to understanding the economy. Since much of the survey’s data is available for the 50 most populous metropolitan areas, it also will bring actionable insights to local policy makers seeking to foster successful entrepreneurial climates, support underrepresented groups, etc.
Only about 2.3% of the 717,795 paid employees of private firms in Austin work for firms that have been in business less than two years. Firms that have been in business less than six years employ 12.7% of the area’s paid employees. Nationally, 2.2% of employees work for the youngest firms and 9.8% work for firms in business less than six years.
Nearly half, 49.4%, of Austin’s paid employees work for the 7.8% of area firms that have been in business 16 or more years. Nationally, 53.8% of employees work for the 3.1% of firms in business 16 or more years.

Over a quarter, 26.3%, of firms in business less than two years in Austin are in the professional, scientific and technical services industry, compared to 14.8% of the youngest businesses nationally. The industry accounts for 21.9% of all firms in Austin and 14.2% nationally.
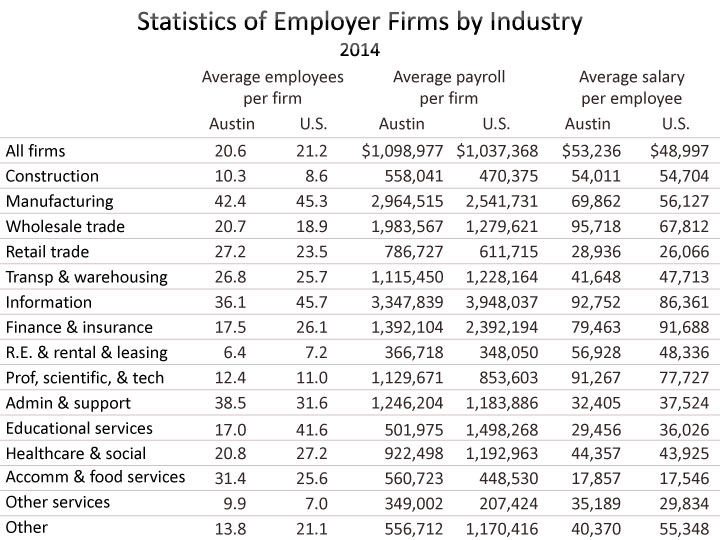
Austin firms less than two years old have 16,264 paid employees. Among these firms, the two industries responsible for creating the most jobs are professional, scientific and technical services and accommodation and food services. The youngest firms in each industry—1,072 firms in professional, scientific and technical services and 303 firms in accommodation and food services—employ between 2,500 and 4,999. (Data suppression for confidentiality means that employment ranges are substituted for specific estimates for some data.) The average salary in Austin for professional, scientific and technical services jobs is $91,267, while that of accommodation and food services is $17,857.
Nationally, a quarter (25.3%) of jobs at firms in business for less than two years are in the accommodation and food services industry. The next two most significant industries for jobs at the youngest firms are health care and social assistance (12.7% of jobs) and professional, scientific and technical services (9.4%).
In Austin, 7,308, or 21.0%, of employer firms are female-owned, compared to 19.4% nationally. Male-owned firms account for 58.3% of firms in Austin and 61.3% nationally. Women-owned firms account for 7.3% of employees and 4.6% of payrolls in Austin, while women-owned firms account for 7.4% of employees and 4.9% of payrolls nationally. As the graph above indicates, male-owned businesses account for greater shares of employees and payrolls in Austin than they do nationally.
The rate of minority ownership of employer firms in Austin (17.2%) is similar to the national rate (17.5%), while nonminority (i.e., non-Hispanic white population) ownership is lower in Austin (71.2%) than applies nationally (76.8%), due to higher shares in Austin of equally minority/nonminority-owned firms and publically held or non-classifiable firms. However, as the graph above indicates, nonminority-owned firms account for larger shares of employment and payrolls in Austin than these firms do nationally.
Hispanics, which make up 29.6% of Austin’s labor force in 2014, account for 8.1% of employer firms. Hispanics account for 16.4% of the U.S. labor force and 5.5% of all firm owners. Of the 2,818 Hispanic-owned firms in Austin, 536 (19.0%) are in professional, scientific and technical services, and 501 (17.8%) are in accommodation and food services. Nationally, the two most significant industries are accommodation and food services and construction, each accounting for 13.5% of Hispanic owned businesses. In Austin, 3.6% of the private sector workforce is employed by Hispanic-owned firms, compared to 2.1% nationally.
Nationally, veterans own 7.5% of employer firms. In Austin, veterans own 3,090 firms or 8.9% (the rate is boosted to 11.1% if firms that are equally veteran-/nonveteran-owned are included). Professional, scientific, and technical services account for 23.5% of veteran-owned firms in Austin, slightly higher than the 21.9% industry share for all firms. Veterans are notably more represented in financial activities (finance, insurance, real estate, rental and leasing), which account for 16.8% of veteran-owned firms compared to 10.6% for all firms. Veterans own 14.1% of all firms in Austin’s financial activities sector. However, a more remarkable concentration is the arts, entertainment and recreation industry (483 employer firms), where 22.6% are owned by veterans.[1]
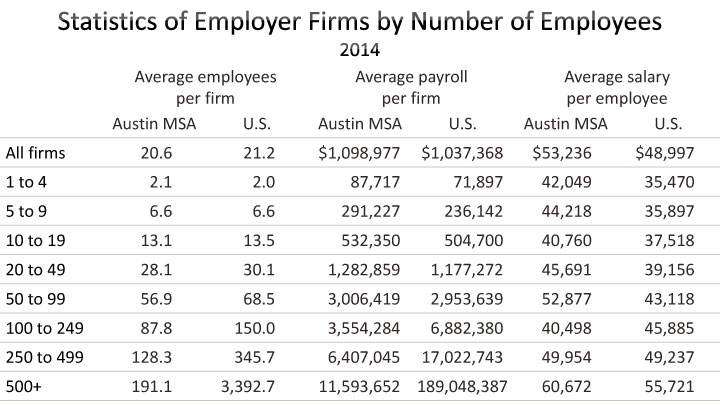
Employer firms with revenues of $1,000,000 or greater number 12,288 in Austin and account for 35.3% of the area employer firms, 88.7% of employees, and 94.1% of payrolls. Nationally, only 25.8% of firms are in this revenue class, but these firms account for percentages of employees (87.3%) and payrolls (93.5%) similar to Austin.
To read more about the new Survey of Entrepreneurs, see the Census Bureau's press release highlighting findings of the inaugural survey, an explanation of survey methodology, and other information. Access the four data tables: the 1st provides data by industry sector, gender, ethnicity, race, and veteran status; the 2nd adds years in business to those characteristics; the 3rd adds receipts size of firm; and the 4th adds employment size of firm. You'll be seeing the table within the Census Bureau's "American FactFinder" data retrieval system and can change the geography you see (national) to your preference using the "action" options at the top of the table.
Each annual survey will include data on a rotating special business component. Yet to be released is this survey cycle’s data collected on business innovation and research and development. We’ve not been able to verify if this data will be produced at the metro level, but if it is, we’ll report on it.
The Austin Business Journal reported on the release of the Annual Survey of Entrepreneurs here and here.
Footnotes:
[1] Arts, entertainment and recreation is a relatively small industry that has been aggregated, for the sake of space, into "Other" in the several industry graphs.


